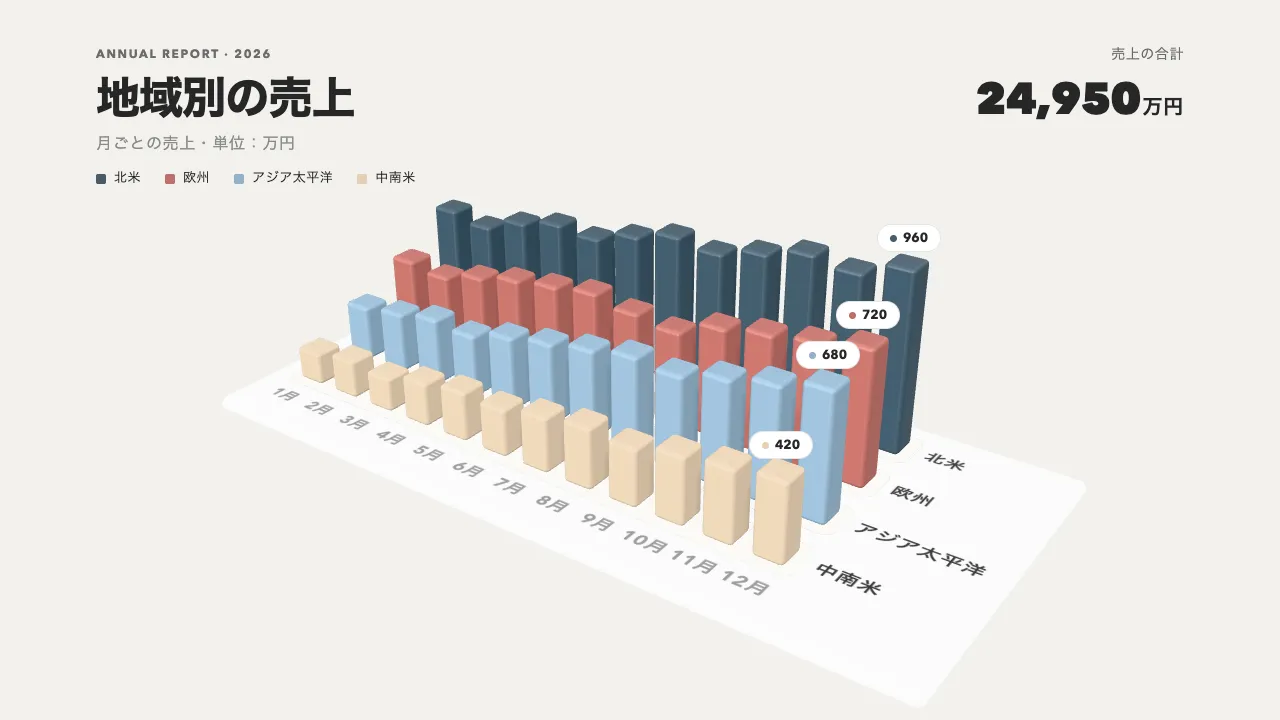
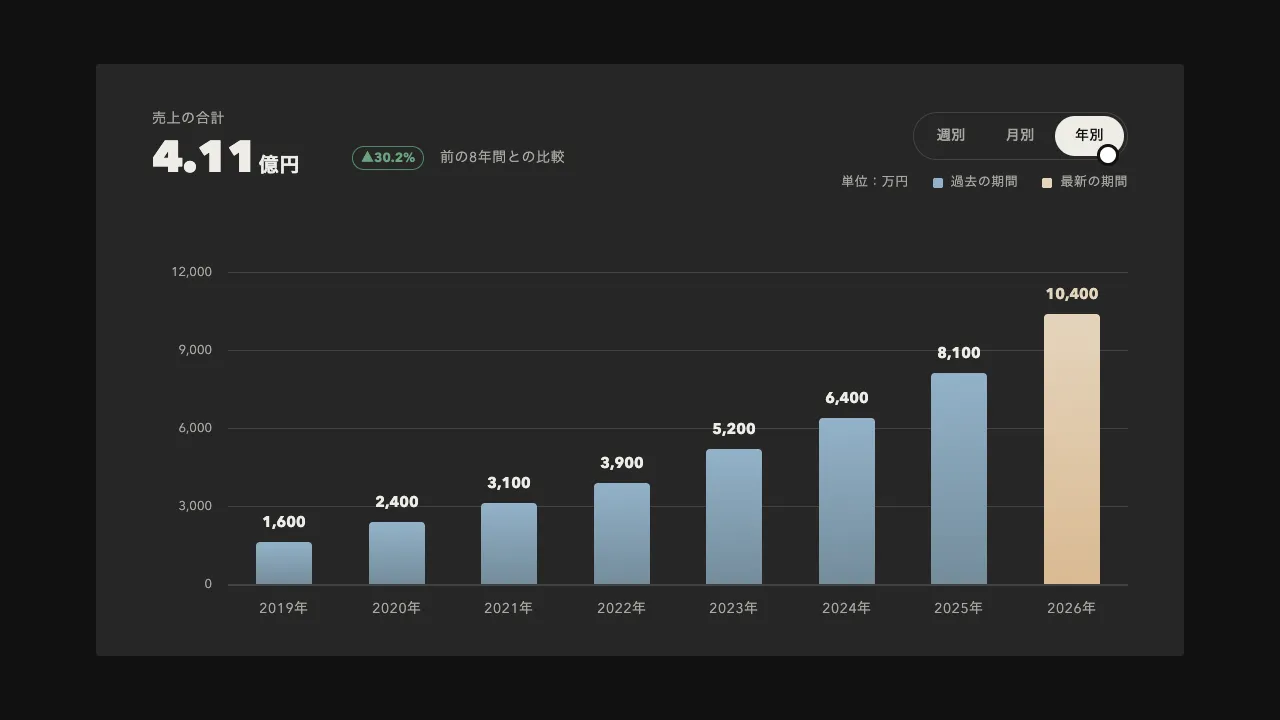
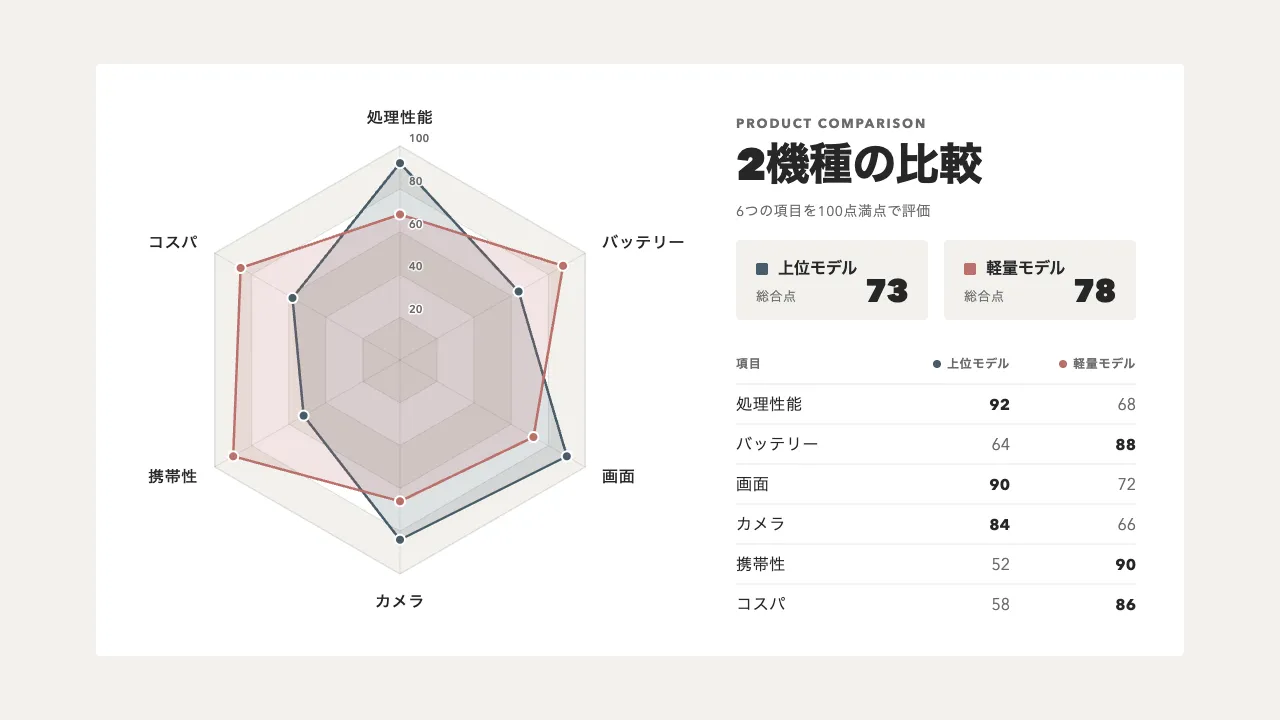
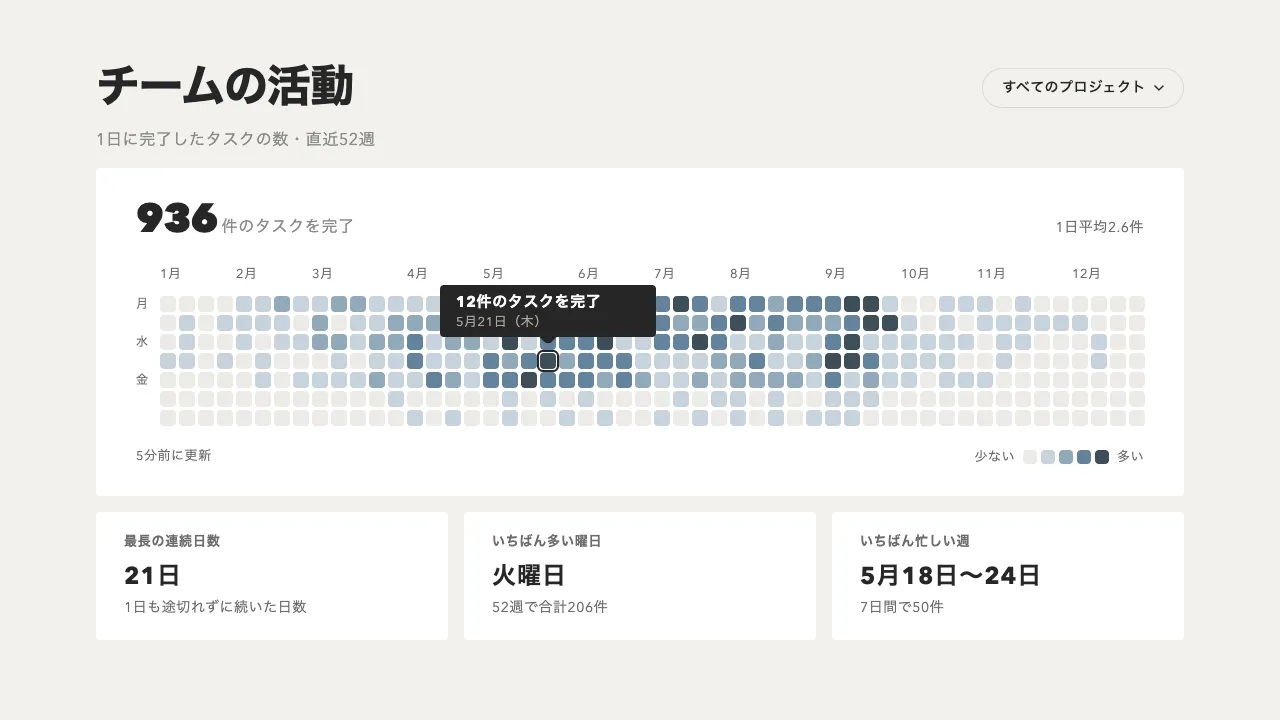
デモ
デモを読み込めませんでした。
仕様
- 用途
- グラフ
- 動作
- DOM
- 種類
- レシピ
- 動作確認
- three 0.186.0・gsap 3.15.0
- 公開日
しくみと調整
前年度の棒が立ったあと、増減の段が左から順に、前の段が届いた高さから次の高さへ伸びます。増えた要因は上向きで成功の緑、減った要因は下向きでエラーの朱にし、段と段のあいだは高さを渡す点線でつなぎます。最後に今年度の合計の棒が下から立ち、始まりと終わりの高さを見比べられます。
棒は「始まりの値から終わりの値へ、進みに合わせて伸ばす」1 つの形にそろえてあります。前年度も、増減の段も、合計も同じ計算で描けるので、上向きと下向きで場合分けが要りません。1 本が伸びるのは 0.5 秒、次の段は 0.45 秒遅れて始め、点線はその段が伸び終わるころに 0.2 秒で引きます。
値の札は、増えた段と合計は棒の上、減った段は棒の下に置きます。すべて上に置くと、減った段の札が点線と重なって読めません。札の字は、暗い地で読めるよう、棒より一段明るい緑と朱で書きます。棒の上下の辺と点線の位置は整数に丸めます。半端な位置の辺は、描き直しのたびに縁の 1 画素が変わります。
段に重ねると、その段までの累計の高さへ破線の目安が横に伸び、右端に累計の札が出ます。目安の線は段ごとに 1 本ずつ置き、重ねた段のものだけを出すので、線が飛び移りません。値は表としてページに書き、スクリプトはその表を読んで段を組みます。表は見えなくするだけにして読み上げに残し、枠は焦点を受けて左右の矢印キーで段を移れるようにします。
つまみは、段どうしのずれ・伸びる時間・目盛りの上端です。上端を高いほうの累計に近づけすぎると、小さな要因の段がつぶれて読めません。要因は 5 つまでにし、細かいものは「その他」にまとめます。売上や利益が前の期からどう動いたかを説明するレポート、予算と実績の差を要因に分ける節に向いています。
コード
<figure class="fall" data-max="2500">
  <figcaption class="fall__caption">
    <span class="fall__eyebrow">Revenue bridge</span>
    <span class="fall__title">売上を動かした要因</span>
    <span class="fall__note"><span>2026年度・売上の増減要因・</span><span>単位:万円</span></span>
  </figcaption>

  <!-- 目盛りと項目名は HTML に置き、段と点線だけを JS が描く。枠は焦点を受け、矢印キーで要因を移れる -->
  <div class="fall__plot">
    <div class="fall__grid" tabindex="0" role="group" aria-label="売上の増減要因のグラフ。左右の矢印キーで要因を移れます">
      <svg class="fall__svg" aria-hidden="true"></svg>
      <ul class="fall__y" aria-hidden="true">
        <li style="--v: 1">2,500</li>
        <li style="--v: 0.8">2,000</li>
        <li style="--v: 0.6">1,500</li>
        <li style="--v: 0.4">1,000</li>
        <li style="--v: 0.2">500</li>
        <li style="--v: 0">0</li>
      </ul>
      <ul class="fall__x" aria-hidden="true">
        <li style="--i: 0">前年度</li>
        <li style="--i: 1">新規顧客</li>
        <li style="--i: 2">単価改善</li>
        <li style="--i: 3">解約</li>
        <li style="--i: 4">為替</li>
        <li style="--i: 5">その他</li>
        <li style="--i: 6">今年度</li>
      </ul>
    </div>
  </div>
  <p class="fall__status" role="status"></p>

  <!-- 値はこの表が正。最初と最後の行は合計の棒、あいだの行は前の累計から次の累計へ伸びる段になる -->
  <table class="fall__table">
    <caption>2026年度の売上の増減要因(万円)</caption>
    <thead>
      <tr><th scope="col">項目</th><th scope="col">増減</th><th scope="col">累計</th></tr>
    </thead>
    <tbody>
      <tr><th scope="row">前年度</th><td>—</td><td>1,200</td></tr>
      <tr><th scope="row">新規顧客</th><td>+680</td><td>1,880</td></tr>
      <tr><th scope="row">単価改善</th><td>+420</td><td>2,300</td></tr>
      <tr><th scope="row">解約</th><td>−320</td><td>1,980</td></tr>
      <tr><th scope="row">為替</th><td>−220</td><td>1,760</td></tr>
      <tr><th scope="row">その他</th><td>+240</td><td>2,000</td></tr>
      <tr><th scope="row">今年度</th><td>—</td><td>2,000</td></tr>
    </tbody>
  </table>
</figure>.fall {
--bg: #111111;
--ink: #eeece6;
--mute: #898989;
--mute-small: #a8a6a0; /* 16px 未満の文字 */
--line: rgb(238 236 230 / 0.14);
--total: #93b2c9; /* 前年度・今年度の棒 */
--up: #4f8a64; /* 増えた要因(成功の緑) */
--down: #c4553d; /* 減った要因(エラーの朱) */
--total-text: var(--total); /* 値の札の字。増減は、暗い地で読める明るい段 */
--up-text: #6ba37f;
--down-text: #e07a62;
--height: 340px; /* グラフの高さ */
position: relative;
display: grid;
gap: 24px;
overflow: clip; /* 読み上げ用に隠した表が、狭い画面で横にはみ出さないように */
margin: 0;
padding: 48px clamp(16px, 5vw, 96px);
background: var(--bg);
color: var(--ink);
font-variant-numeric: tabular-nums;
}
.fall__caption { display: grid; gap: 10px; }
.fall__eyebrow { color: var(--mute-small); font-size: 13px; font-weight: 700; letter-spacing: 0.14em; text-transform: uppercase; }
.fall__title { font-size: clamp(28px, 5vw, 44px); font-weight: 800; line-height: 1.1; letter-spacing: -0.02em; }
.fall__note { color: var(--mute); font-size: 16px; letter-spacing: 0.04em; }
.fall__note span { display: inline-block; } /* 狭い画面でも、語の途中で折り返さない */
/* 左に目盛り、下に項目名、右に累計の札を置く余白 */
.fall__plot { padding: 0 124px 34px 52px; }
.fall__grid {
position: relative;
height: var(--height);
/* 目盛りの線。下端から 20% ごとに 1px(上端の線だけは影で引く) */
background-image: repeating-linear-gradient(to top, var(--line) 0 1px, transparent 1px 20%);
box-shadow: inset 0 1px 0 var(--line);
}
.fall__grid:focus-visible { outline: 2px solid var(--ink); outline-offset: 6px; }
.fall__svg { display: block; width: 100%; height: 100%; }
.fall__svg text { font-size: 16px; font-weight: 700; letter-spacing: -0.01em; text-anchor: middle; }
.fall__svg .fall__dot { stroke: var(--mute); stroke-dasharray: 2 5; stroke-linecap: round; }
.fall__svg .fall__guide { stroke: var(--ink); stroke-dasharray: 5 5; }
.fall__svg .fall__hit { fill: transparent; cursor: pointer; }
.fall__y,
.fall__x { margin: 0; padding: 0; color: var(--mute-small); font-size: 13px; list-style: none; }
.fall__y li { position: absolute; right: calc(100% + 10px); bottom: calc(var(--v) * 100%); transform: translateY(50%); }
.fall__x li { position: absolute; top: 100%; left: calc((var(--i) + 0.5) / 7 * 100%); transform: translate(-50%, 12px); white-space: nowrap; }
/* 累計の札。目盛りの右の外に置く */
.fall__chip {
position: absolute;
left: 100%;
margin: 0 0 0 12px;
padding: 4px 12px;
border-radius: 4px;
background: var(--ink);
color: var(--bg);
font-size: 14px;
font-weight: 700;
letter-spacing: 0.04em;
white-space: nowrap;
opacity: 0;
transform: translateY(-50%);
pointer-events: none;
}
/* 狭い画面では項目名を縦組みにし、累計の札はグラフの中の右端へ寄せる */
@media (max-width: 640px) {
.fall { --height: 280px; }
.fall__plot { padding: 0 0 72px 44px; }
.fall__x li { writing-mode: vertical-rl; }
.fall__svg text { font-size: 13px; }
.fall__value--total { display: none; } /* 前年度と今年度の額は列に入らないので、表と札に任せる */
.fall__chip { left: auto; right: 0; margin: 0; }
}
/* 読み上げだけに届ける。表は、スクリプトが段を描くまで見えたまま残す */
.fall__status,
.fall.is-live .fall__table { position: absolute; width: 1px; height: 1px; margin: 0; overflow: hidden; clip-path: inset(50%); white-space: nowrap; }
.fall__table { width: 100%; border-spacing: 0; }
.fall__table caption { padding-bottom: 12px; color: var(--mute-small); font-size: 13px; text-align: left; }
.fall__table th,
.fall__table td { padding: 10px 12px; border-top: 1px solid var(--line); font-size: 14px; text-align: right; }
.fall__table th:first-child { text-align: left; }
.fall__table thead th { border: 0; color: var(--mute-small); font-size: 13px; font-weight: 600; }import { gsap } from "gsap";
// 動きを減らす設定では、伸びも目安の線も一瞬で切り替える
const reduceMotion = window.matchMedia("(prefers-reduced-motion: reduce)").matches;
const time = (seconds) => (reduceMotion ? 0 : seconds);
const attr = (el, values) => { for (const [key, value] of Object.entries(values)) el.setAttribute(key, value); };
const value = (cell) => Number(cell.textContent.replace(/[^\d.]/g, ""));
const add = (svg, tag, className) => { const el = document.createElementNS("http://www.w3.org/2000/svg", tag); el.setAttribute("class", className); return svg.appendChild(el); };
document.querySelectorAll(".fall").forEach((chart) => {
const [svg, grid] = [chart.querySelector(".fall__svg"), chart.querySelector(".fall__grid")];
const status = chart.querySelector(".fall__status");
const max = Number(chart.dataset.max);
const color = (name) => getComputedStyle(chart).getPropertyValue(`--${name}`);
// 値は表が正。最初と最後の行は 0 から立つ合計の棒、あいだの行は前の累計から自分の累計へ伸びる段
const rows = [...chart.querySelectorAll("tbody tr")];
const bars = rows.map((row, i) => {
const total = i === 0 || i === rows.length - 1;
const from = total ? 0 : value(rows[i - 1].cells[2]);
const to = value(row.cells[2]);
const bar = { name: row.cells[0].textContent, sum: row.cells[2].textContent, from, to, total, up: total || to > from, g: 0, lb: 0, c: 0, h: 0 };
bar.rect = add(svg, "rect", "fall__bar");
bar.text = Object.assign(add(svg, "text", total ? "fall__value fall__value--total" : "fall__value"), { textContent: total ? `${bar.sum}万円` : row.cells[1].textContent });
const kind = total ? "total" : bar.up ? "up" : "down"; // 字の色は --〇〇-text(暗い地で読める明るい段)
[bar.rect.style.fill, bar.text.style.fill] = [color(kind), color(`${kind}-text`)];
bar.guide = add(svg, "line", "fall__guide");
if (i < rows.length - 1) bar.dot = add(svg, "line", "fall__dot"); // 次の段へ高さを渡す点線
bar.chip = grid.appendChild(Object.assign(document.createElement("p"), { className: "fall__chip", textContent: `${bar.sum}万円` }));
return bar;
});
const hits = bars.map(() => add(svg, "rect", "fall__hit")); // 当たり判定は列いっぱい(細い段も押さえやすい)
chart.classList.add("is-live"); // ここから先は、表は読み上げにだけ残す
let [w, h] = [0, 0];
const yOf = (v) => h - (v / max) * h;
const draw = () => {
const slot = w / bars.length;
const width = Math.round(Math.min(88, slot * 0.62));
bars.forEach((bar, i) => {
const x = Math.round(slot * i + (slot - width) / 2);
const level = Math.round(yOf(bar.to)) + 0.5; // 1px の線は、画素の境目をまたがないよう 0.5 ずらす
// 始まりの値から終わりの値へ伸ばす(増は上向き、減は下向き)
const now = bar.from + (bar.to - bar.from) * bar.g;
const top = Math.round(yOf(Math.max(bar.from, now)));
attr(bar.rect, { x, width, rx: 2, y: top, height: Math.max(0, Math.round(yOf(Math.min(bar.from, now))) - top) });
// 値の札は、増えた段と合計は棒の上、減った段は棒の下。出るときに 8px 寄る
attr(bar.text, { x: x + width / 2, opacity: bar.lb.toFixed(3), y: Math.round(bar.up ? yOf(Math.max(bar.from, bar.to)) - 12 + (1 - bar.lb) * 8 : yOf(Math.min(bar.from, bar.to)) + 26 - (1 - bar.lb) * 8) });
if (bar.dot) attr(bar.dot, { x1: x + width, y1: level, y2: level, x2: Math.round(x + width + (slot - width) * bar.c) });
attr(bar.guide, { x1: 0, y1: level, y2: level, x2: Math.round(w * bar.h), opacity: bar.h.toFixed(3) });
attr(hits[i], { x: Math.round(slot * i), y: 0, width: Math.round(slot), height: h });
bar.chip.style.cssText = `top:${Math.round(yOf(bar.to))}px;opacity:${bar.h}`;
});
};
new ResizeObserver(() => {
({ width: w, height: h } = grid.getBoundingClientRect());
svg.setAttribute("viewBox", `0 0 ${w} ${h}`);
draw();
}).observe(grid);
// 画面に入ったら 1 回だけ伸ばす。合計の棒は、増減の段が出そろってから立てる
const play = () => {
const tl = gsap.timeline({ onUpdate: draw });
bars.forEach((bar, i) => {
const at = i === 0 ? 0 : i === bars.length - 1 ? 3.15 : 0.7 + 0.45 * (i - 1);
tl.to(bar, { g: 1, duration: i === bars.length - 1 ? 0.7 : 0.5, ease: "power3.out" }, at)
.to(bar, { lb: 1, duration: 0.3 }, at + 0.15)
.to(bar, { c: 1, duration: 0.2, ease: "none" }, at + 0.35);
});
if (reduceMotion) tl.progress(1); // 動きを減らす設定では、出そろった絵で置く
};
const io = new IntersectionObserver(([entry]) => {
if (!entry.isIntersecting) return;
io.disconnect();
play();
}, { rootMargin: "0px 0px -20%" });
io.observe(chart);
// 重ねた段の累計の高さへ、目安の線と札を出す
let active = -1;
const show = (index) => {
if (index === active) return;
active = index;
gsap.to(bars, { h: (i) => (i === index ? 1 : 0), duration: time(0.25), ease: "power2.out", overwrite: "auto", onUpdate: draw });
const bar = bars[index];
status.textContent = bar ? `${bar.name} ${bar.total ? "" : `${bar.text.textContent}万円、`}累計${bar.sum}万円` : "";
};
hits.forEach((hit, i) => {
hit.addEventListener("pointerenter", (e) => e.pointerType !== "touch" && show(i));
hit.addEventListener("pointerdown", () => show(i)); // 指で触れたときも、その段を出す
});
svg.addEventListener("pointerleave", (e) => e.pointerType !== "touch" && show(-1));
// キーボードでは最初の段から出し、矢印キーで移る。Esc で閉じる
grid.addEventListener("focus", () => grid.matches(":focus-visible") && show(Math.max(active, 0)));
grid.addEventListener("blur", () => show(-1));
grid.addEventListener("keydown", (e) => {
const step = { ArrowRight: 1, ArrowDown: 1, ArrowLeft: -1, ArrowUp: -1 }[e.key];
if (!step) return e.key === "Escape" ? show(-1) : undefined;
e.preventDefault();
show(active < 0 ? 0 : (active + step + bars.length) % bars.length);
});
});